Healthcare Pricing Finally Transparent
Ask our AI to search billions of federally mandated hospital and insurer prices. Compare cash, in-network, and out-of-network rates side by side.
How It Works
From scattered government files to instant price comparisons — here's how we make healthcare pricing transparent.
We Collect
Federal law The Hospital Price Transparency Final Rule requires hospitals to publish their prices. requires providers and payers to publish their real prices under the Hospital Price Transparency Final Rule and the Transparency in Coverage Rule. We automatically monitor thousands of these machine-readable files Machine-readable files are large digital documents (often JSON or CSV) published by hospitals and insurers that list negotiated rates, cash prices, and more for medical services. so you don't have to.
- 6,000+
- Providers
- 400+
- Payers
- Updated Monthly
Live Data Sources
- ActiveProvider Price Files6,000+
- ActivePayer Rate Files400+
- MonitoringFederal Compliance DataDaily
Current Monthly Data Processing Status
We Organize
We take trillions of raw data points and transform them into a clean, searchable format that makes sense. No more wading through spreadsheets. Now you can get straight to the answers you need.
- 2.4T+
- Pricing Records
- 99.9%
- Data Accuracy
- Real-time Processing
You Compare
Instantly see and compare prices for providers, payers, and cash options side-by-side. Use this information to save money, avoid surprise bills, and choose what's best for you.
Price Comparison Example
Ready to see what you'll actually pay?
Join thousands of patients who've saved money by comparing healthcare prices before their procedures.
What the Data Reveals
Our analysis uncovers surprising truths about healthcare pricing and savings opportunities for patients.
10x
Same procedure can cost 10x more at different providers in the same city
33%
Of the time, "in-network" costs more than cash prices
$3,200
Average savings when patients compare prices before care
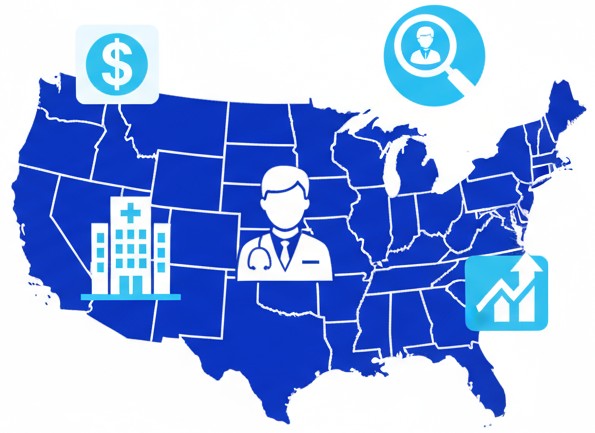
Who Uses HealthFees.org
Patients & Families
Save an average of $1,000 per procedure by comparing prices before care.
Transparency Scoring & Compliance Support
Recognizing leaders and supporting progress — we measure every provider and payer's transparency and help them achieve full compliance.
Top Transparency Leaders
Compliance Across the Industry
Check your Transparency Score or request compliance support to join the leaders in healthcare transparency.
Explore HealthFees.org
From quick price comparisons to in-depth market analysis, we have tools for every healthcare stakeholder.