%20--%3e%3csvg%20version='1.0'%20id='Layer_1'%20xmlns='http://www.w3.org/2000/svg'%20xmlns:xlink='http://www.w3.org/1999/xlink'%20x='0px'%20y='0px'%20viewBox='0%200%20755.52%20814.35'%20style='enable-background:new%200%200%20755.52%20814.35;'%20xml:space='preserve'%3e%3cstyle%20type='text/css'%3e%20.st0{fill:%231ae5ce;stroke:%231ae5ce;stroke-width:7;stroke-miterlimit:10;}%20.st1{fill:%23FFFFFF;stroke:%231ae5ce;stroke-width:7;stroke-miterlimit:10;}%20.st2{fill:%231ae5ce;stroke:%23FFFFFF;stroke-width:7;stroke-miterlimit:10;}%20.st3{fill:%23FFFFFF;stroke:%23FFFFFF;stroke-width:6;stroke-miterlimit:10;}%20%3c/style%3e%3cg%20id='Dark_Logo_00000159431215648494653180000015900878925932721032_'%3e%3cpath%20id='shield_00000152259091539869183100000001926543869452564382_'%20class='st0'%20d='M711.13,173.42%20c-3.37-49.07-38.92-44.9-75.96-52.18c-67.4-13.25-130.47-34.47-192.36-63.92c-22.48-10.7-41.88-25.74-65.05-26.28%20c-23.17,0.54-42.58,15.59-65.05,26.28c-61.89,29.45-124.95,50.68-192.36,63.92c-37.04,7.28-72.59,3.11-75.96,52.18%20c-1.55,22.6,0.34,46.4,1.05,68.92c5.99,190.78,52.91,345.39,206.27,466.46c29.71,23.46,74.51,55.8,108.84,70.75%20c5.99,2.61,11.7,3.73,17.21,3.75c5.51-0.02,11.22-1.14,17.21-3.75c34.33-14.95,79.12-47.3,108.84-70.75%20c153.37-121.07,200.28-275.68,206.27-466.46C710.79,219.82,712.68,196.02,711.13,173.42z'/%3e%3cpath%20id='magnifyingglass_00000073685934697636024790000000342567780940956808_'%20class='st1'%20d='M648.78,624.21l-96.64-104.65%20c34.89-40.63,55.98-93.46,55.98-151.21c0-128.27-103.98-232.24-232.24-232.24S143.63,240.08,143.63,368.35%20s103.98,232.24,232.24,232.24c48.87,0,94.21-15.11,131.62-40.89l97.18,105.24c11.25,12.18,30.24,12.93,42.42,1.69l0,0%20C659.27,655.38,660.03,636.39,648.78,624.21z'/%3e%3ccircle%20id='ellipse_00000129904010550392394720000017056154833629780114_'%20class='st2'%20cx='375.87'%20cy='368.35'%20r='181.21'/%3e%3cpath%20id='dollarsign_00000057140127156649725250000003772530148495155891_'%20class='st3'%20d='M362.91,492.03v-23.91%20c0-2.01-1.58-3.69-3.59-3.77c-18.49-0.78-37.12-5.4-49.4-11.83c-1.75-0.92-2.53-3.01-1.76-4.84l5.87-13.89%20c0.86-2.02,3.23-2.88,5.2-1.89c12.94,6.52,30.45,11.44,49.18,11.44c26.02,0,43.6-12.73,43.6-30.43c0-17.08-14.29-27.63-41.4-36.95%20c-37.37-12.42-60.46-26.7-60.46-53.72c0-24.97,20.29-44.11,52.22-49.51c1.8-0.31,3.11-1.89,3.11-3.72v-24.35%20c0-2.09,1.69-3.78,3.78-3.78h15.16c2.09,0,3.78,1.69,3.78,3.78v22.71c0,2.01,1.58,3.67,3.58,3.77c17.85,0.92,30.88,4.75,40.61,9.1%20c1.92,0.86,2.79,3.09,1.94,5.01l-6.08,13.6c-0.85,1.91-3.09,2.77-4.99,1.91c-8.37-3.8-22.38-8.95-42.75-8.95%20c-28.21,0-38.84,14.28-38.84,26.7c0,16.15,13.56,24.22,45.44,35.4c37.74,13.04,56.79,29.19,56.79,56.82%20c0,23.85-19.05,46.23-54.78,52.3c-1.8,0.31-3.11,1.89-3.11,3.72v25.28c0,2.09-1.69,3.78-3.78,3.78h-15.53%20C364.6,495.81,362.91,494.12,362.91,492.03z'/%3e%3c/g%3e%3c/svg%3e)

CMS phased out “estimated allowed amounts” — a data element it had only added one year earlier — and replaced it with median and percentile figures. The reason why reveals something important about how hospitals have been reporting prices.
Section 1: A Quick History of the Data Element Nobody Talked About
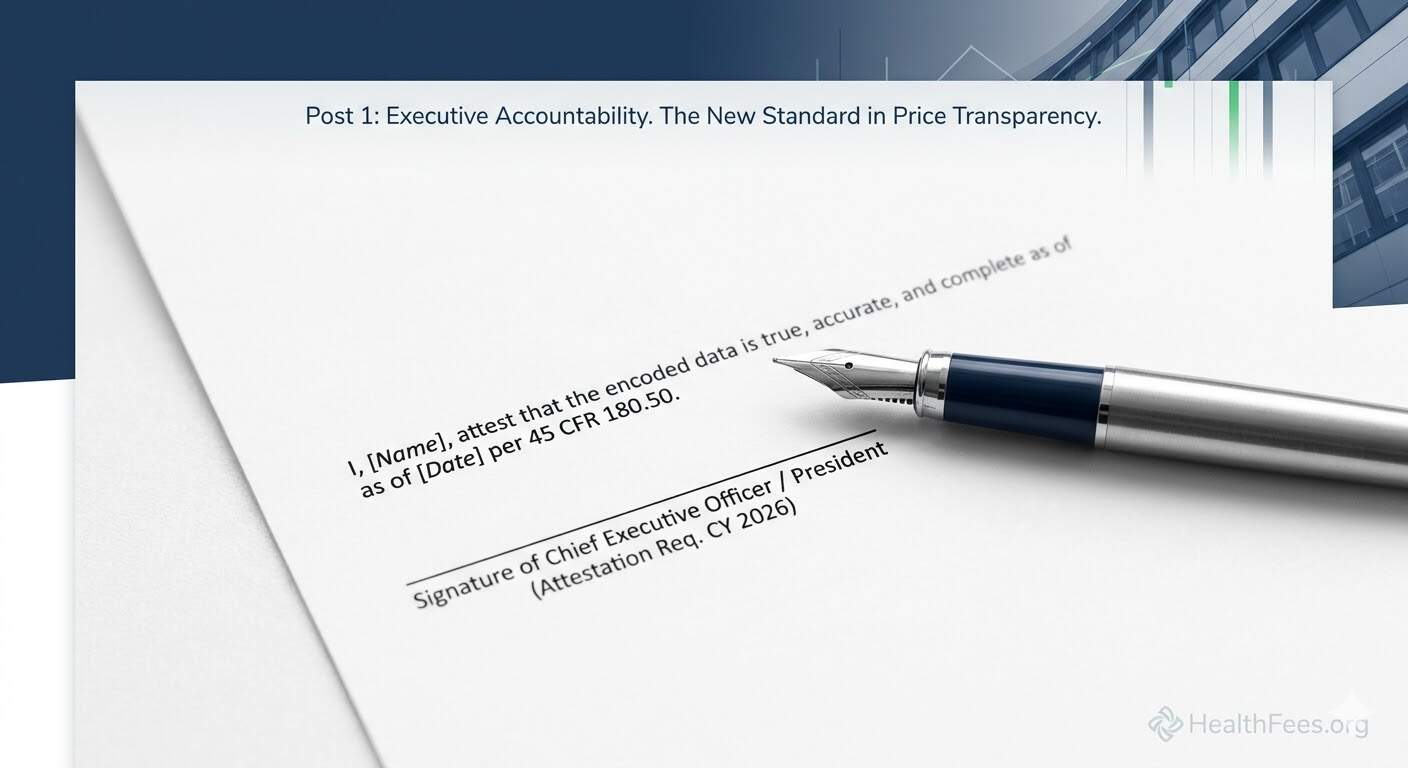
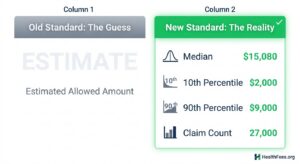
Key 2026 changes to machine-readable files include replacing estimated allowed amounts as the listed element when payer-specific negotiated charges are expressed as a percentage or algorithm. Instead, hospitals must now convey the median allowed amount and the 10th and 90th percentile allowed amounts. The rule thereby phases out estimated allowed amounts only one year after CMS added them as a required MRF component.
Why did CMS add them, then immediately remove them? Because hospitals often set prices via complex formulas — a percentage of Medicare rates, for instance — rather than fixed dollar amounts. The “estimated allowed amount” was supposed to translate those formulas into dollars. In practice, it created a data field that varied wildly in how it was calculated, making cross-hospital comparison unreliable.
Section 2: What Median and Percentile Data Actually Shows
The shift to median and percentile amounts is significant because it forces hospitals to use real claims data — not projections or formula outputs.
Hospitals must calculate these figures using electronic data interchange 835 electronic remittance advice transaction data, or an equivalent source of remittance data. The lookback period has been finalized as no less than 12 months and no longer than 15 months prior to the date the MRF is posted.
What this means in plain language:
- Median allowed amount: The midpoint of what a hospital actually received from a payer for a given service in the past year
- 10th percentile: The low end of what was paid (useful for identifying underpriced outliers)
- 90th percentile: The high end (useful for identifying overpriced outliers)
Count of claims: How many instances underlie the data, enabling statistical confidence assessment
Section 3: Why Price Variance Was Always There — We Just Couldn’t See It
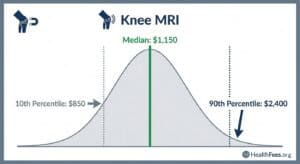
Intra-state price variation for major procedures averages a ratio of 3.2 to 3.4 between the highest and lowest negotiated rates. In Pennsylvania alone, the UnitedHealthcare rate for a major bowel procedure ranged from $18,066 to $87,457 — a ratio of 4.8 — at different hospitals.
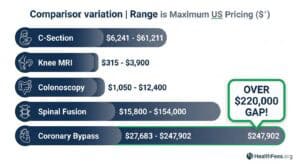
Procedures like coronary bypass ranged from $27,683 to $247,902 nationally — an absolute difference of $220,219.
That range exists within data that was always technically available but practically unreadable. The shift to median/percentile figures is the regulatory acknowledgment that real numbers matter more than formula outputs.
Section 4: The Confidence Problem — And How Count of Claims Helps
One underreported aspect of the new rule: hospitals must also publish the count of allowed amounts underlying each median figure.
For low-volume services where the count is 1–10, hospitals should encode the count as “1 through 10” to protect patient privacy. If there are zero claims, hospitals should encode “0” and leave the allowed amounts blank.
This matters because a “median” based on two claims is statistically meaningless. A median based on 400 claims is reliable. Knowing the count lets researchers and employers assess whether a price is signal or noise.
Section 5: What to Do With This
- Employers: When reviewing network rates, ask whether your TPA has access to the new median/percentile MRF data — not just chargemaster rates
- Researchers: The 10th/90th percentile spread is now a publishable, citable metric for pricing inequality studies
- Patients: Median allowed amounts are the closest approximation of what a procedure actually costs at a given hospital — not what it’s “listed” at
Search your procedure at HealthFees.org. Compare actual median rates, not list prices.