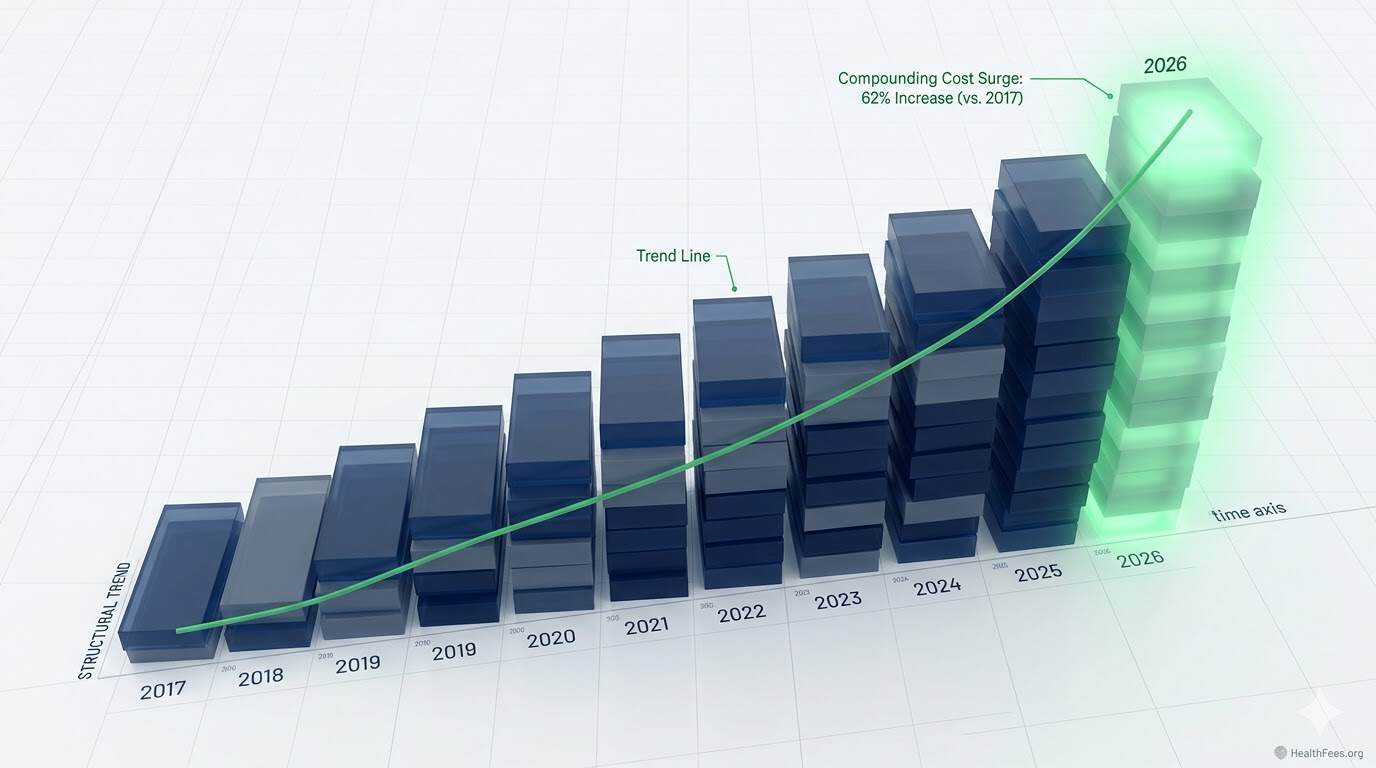
Employers are forecasting a 9% healthcare cost increase in 2026 — the third consecutive year of costs outpacing projections. On a compounded basis, costs are on track to be 62% higher than 2017 levels.
Section 1: The Numbers
Employers will face similar challenges in 2026 as in previous years, at a steeper trajectory. In 2023 and 2024, employers experienced the highest back-to-back increases in a decade, surpassing projections. Employers predict that healthcare cost trend increases for 2026 will come in at a median of 9%, which employers will manage down to 7.6% with plan design changes. On a compounded basis, costs in 2026 are likely to be 62% higher than 2017 levels.
PwC projects the medical cost trend in 2026 to remain at 8.5% for the group market — with pharmacy cost trend running 2.5 percentage points higher than overall medical trend.

Section 2: What’s Actually Driving It
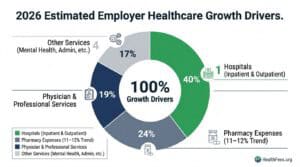
Three categories dominate:
Hospital costs: Hospitals account for 40% of overall healthcare spending growth in the past year.
Pharmacy: In 2024, nearly a quarter of all employer healthcare spend went to pharmacy expenses. Employers are forecasting an 11–12% increase in pharmacy costs heading into 2026 — a situation not remediable by plan design changes alone.
GLP-1s and specialty drugs: More employers say that increases in obesity treatments such as GLP-1s are driving healthcare costs. In addition, employers reported an increase in the prevalence of cancer and higher utilization of mental health services.
Section 3: Why Plan Design Changes Alone Don’t Work
Higher deductibles and narrower networks shift cost to employees — they don’t reduce the unit price of care. The data makes this distinction clearly.
New Jersey’s health department found that cost increases are primarily driven by increasing prices, not by increased utilization — a finding consistent with national research patterns.
Price is the variable. Utilization is not. Strategies that don’t address unit price are containment strategies, not cost reduction strategies.
Section 4: The Data Gap Employers Are Solving For
Employers identify navigation to higher-quality providers (selected by 82% of employers), greater transparency of quality data (82%), and coordination of integrated care teams (79%) as the approaches most likely to improve care value.
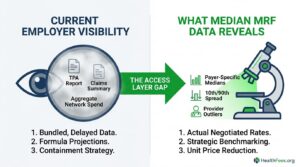
Despite the availability of transparency data, most patients select providers based on referral patterns, brand reputation, or location — not cost. Meanwhile, employers and health plans often lack clear visibility into where pricing variation exists within their networks.
The data exists. The access layer is the gap.
Section 5: A Framework for Employer Action
- Benchmark current network rates against MRF-published median allowed amounts for your top 10–15 procedure codes
- Identify outlier providers — facilities where your negotiated rate exceeds the 90th percentile in the MRF
- Review pharmacy separately — hospital-administered drugs and PBM arrangements require distinct analysis
- Evaluate COE (Center of Excellence) programs for high-cost conditions — often the most defensible cost lever available
Start with one procedure at HealthFees.org. Search what hospitals in your area charge — and what the spread looks like.