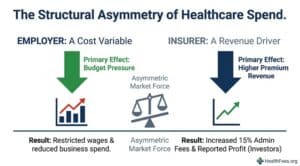
Health insurers reported rising income and profits while employer healthcare costs reached multi-decade highs. These are not coincidental trends — they reflect how the market is structured.
Section 1: The Structure of the Problem
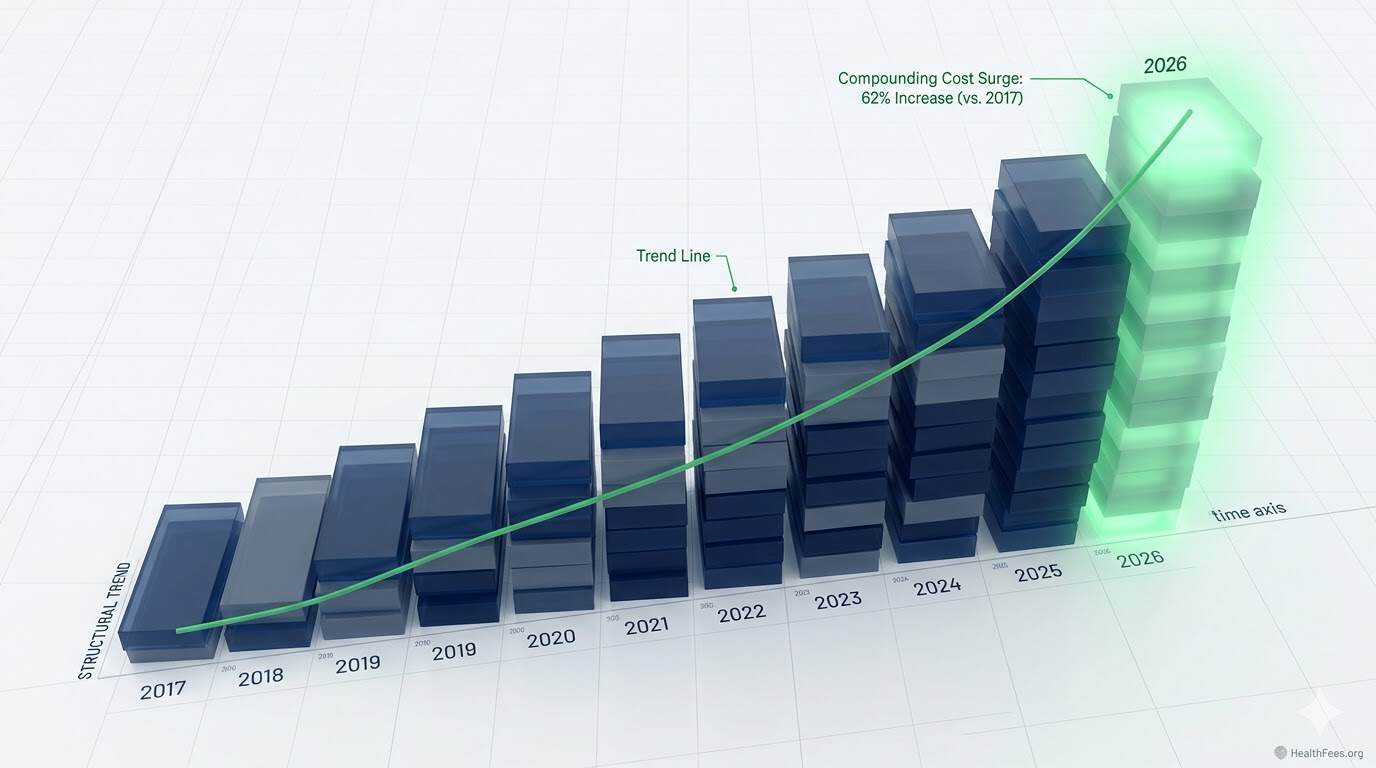
Health insurance costs rose 6% last year while wages grew 4% and general inflation ran at 2.7%. Rising health costs cut into what employers pay in wages and thus limit what employees can spend on groceries, utilities, rent, and childcare.
At the same time, for health insurers, rising health costs allow them to report higher income and profit to investors.
This creates a structural asymmetry: the same variable (total healthcare spend) is a cost for employers and a revenue driver for their plan administrators.
Section 2: What PBGH Found About “Value Networks”
PBGH President Mitchell stated: “A potentially striking lesson is that all of the so-called ‘value networks’ that the health plans sell really are not. If you’re a health insurance company, theoretically, that is your day job. Yet insurance companies are not effective at managing costs in a way that translates for self-insured employers and their workforce.”
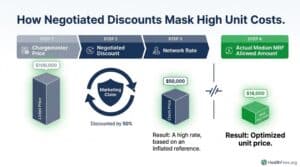
“Value networks” — preferred provider arrangements marketed as cost-optimized — often reflect negotiated discounts off inflated list prices rather than genuinely low unit costs. The reference point matters.
Section 3: What the Price Transparency Data Shows About Network Rates
Across six inpatient procedures, the average difference between Aetna and UHC negotiated rates at the same hospital was $15,366 — equivalent to 30% of the average median procedure price.
Two major insurers, same facility, same procedure — a five-figure spread. If “network” rates were optimized, this gap should not exist systematically across procedures.
A larger portion of price variation across hospitals is explained by hospital market power than by Medicare/Medicaid patient mix, indicating that negotiating leverage — not efficiency — drives rate setting.
Section 4: The Data Access Problem
Gathering PBGH’s data took more than a year, due in part to resistance from insurers and hospitals. “There are a lot of results we couldn’t share because of agreements with the employers and, in many cases, the health insurance companies put serious restrictions on what we could do with the data,” Mitchell said.
Employer claims data — generated by employer plan spend — has historically been controlled by the same entities whose performance it measures. The Transparency in Coverage Rule changes this, but data access and data usability remain distinct problems.
Section 5: What Employers Can Do Structurally
- Request your raw claims data — you are entitled to it; plan language should reflect this
- Benchmark your network rates against MRF median allowed amounts for the same procedures and provider types
- Ask your broker or TPA to disclose all compensation arrangements — the Great Healthcare Plan and related proposals are moving toward mandatory disclosure
- Consider direct contracting with high-volume providers where MRF data shows consistently lower rates
Pull one procedure, one market on HealthFees.org. Compare what your plan pays to what the MRF shows as the median.