Purchaser Business Group on Health (PBGH) members — 40 employers covering 21 million workers — found that the difference between what they paid and what they should have paid wasn’t a rounding error. It was a structural gap hiding in plain sight.
Section 1: The Project That Took Over a Year to Build
The Pacific Business Group on Health (PBGH) launched a data project combining price, quality, and safety metrics to address the need self-insured employers have for comprehensive data when contracting with hospitals and insurers. The 40 PBGH members together spend $350 billion on healthcare annually for their 21 million employees.
The project took more than a year to complete — not because the data was complex, but because of resistance.
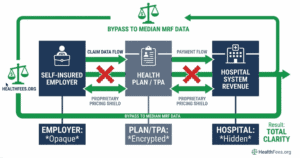
PBGH President and CEO Elizabeth Mitchell noted that health insurance companies placed serious restrictions on what could be done with employer claims data. “There are a lot of results we couldn’t share because of agreements with the employers and, in many cases, the health insurance companies put serious restrictions on what we could do with the data,” she said. “That is antithetical to transparency.”
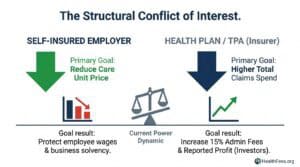
Section 2: The Incentive Mismatch That Created the Gap
Health insurers are “completely disincented from reducing healthcare costs,” Mitchell explained. “They have the opposite incentives of self-insured employers and families” — rising health costs allow insurers to report higher income and profit to investors.
Hidden fees raise questions about what other data hospitals and health plans have concealed since price transparency rules went into effect in 2021 for hospitals and 2022 for health plans. Mitchell also noted: “A potentially striking lesson is that all of the so-called ‘value networks’ that the health plans sell really are not.”
This is not an accusation against any single company. It is a description of how the system is structured — and why employers bear the cost of that structure.
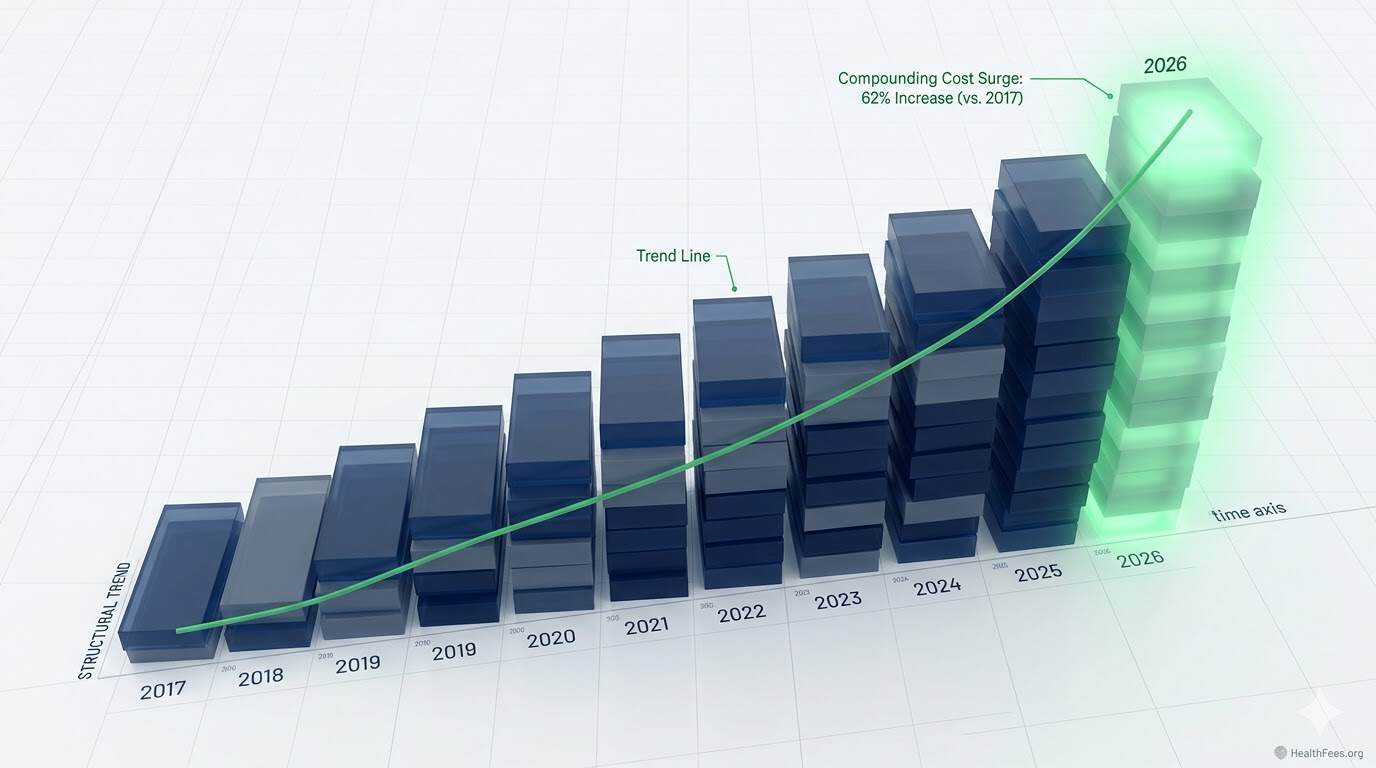
Section 3: What the Price Data Actually Shows
Across six inpatient procedures, the average difference between Aetna and UnitedHealthcare negotiated rates at the same hospital was $15,366 — equivalent to 30% of the average median procedure price.
For a hip and knee joint replacement with complications at one major hospital, the difference between the two payers’ rates was $27,470 — for the same procedure, at the same facility.
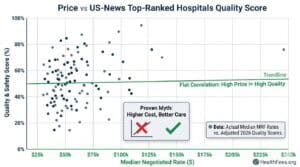
And critically: within a sample of “best hospital” list facilities, there was no observable correlation between aggregate measures of cost and quality.
Higher price ≠ higher quality. The data now exists to demonstrate this at the facility level.
Section 4: The Fiduciary Argument
Because employer-sponsored healthcare spending comes from employee wages and benefits, employers have a fiduciary responsibility to administer benefits in the interest of plan participants. The lack of price transparency limits employers’ ability to knowledgeably develop or implement benefit design decisions.
ERISA’s fiduciary standard applies here. An employer who cannot demonstrate that they assessed pricing reasonableness may face exposure — particularly as plan cost benchmarking data becomes more available and more cited.
Section 5: What Self-Insured Employers Can Actually Do
- Request claims-level data from your health plan — you are entitled to it under the Transparency in Coverage Rule
- Benchmark your negotiated rates against publicly available MRF data for the same procedures and providers
- Use percentile data (now required in MRFs) to identify whether your rates fall above the 90th percentile — a meaningful flag
- Ask your TPA or broker: what is our price index relative to Medicare rates for our top 20 procedure codes?
Look up what hospitals in your area charge for your most common procedures with HealthFees.org. Free access, no registration.